interactive —
American Birthrates Explored
I wanted to create a dataviz single page app without forcing everyone to learn R or D3Js. So what did I do? I created a project for myself to build a Wordpress site that took an Excel document and made it an interactive site with live data.
Role
Front End Developer
Back End Developer
Designer
Animator
Strategy
Software
GreensockJS
Wordpress
HTML/CSS
backstory
Animated SVGs. Wordpress plugins. ScrollMagic and GreensockJS. This site has it all. This project is that it only took 30hrs over 5 days but the best part is, you don't need to be a developer to update the site. You can upload an excel doc with next year's data to the site and voila! Dataviz power to the masses!
assets
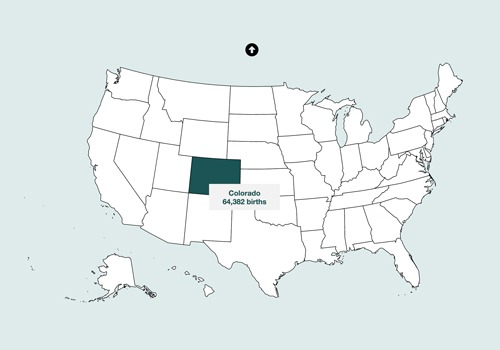
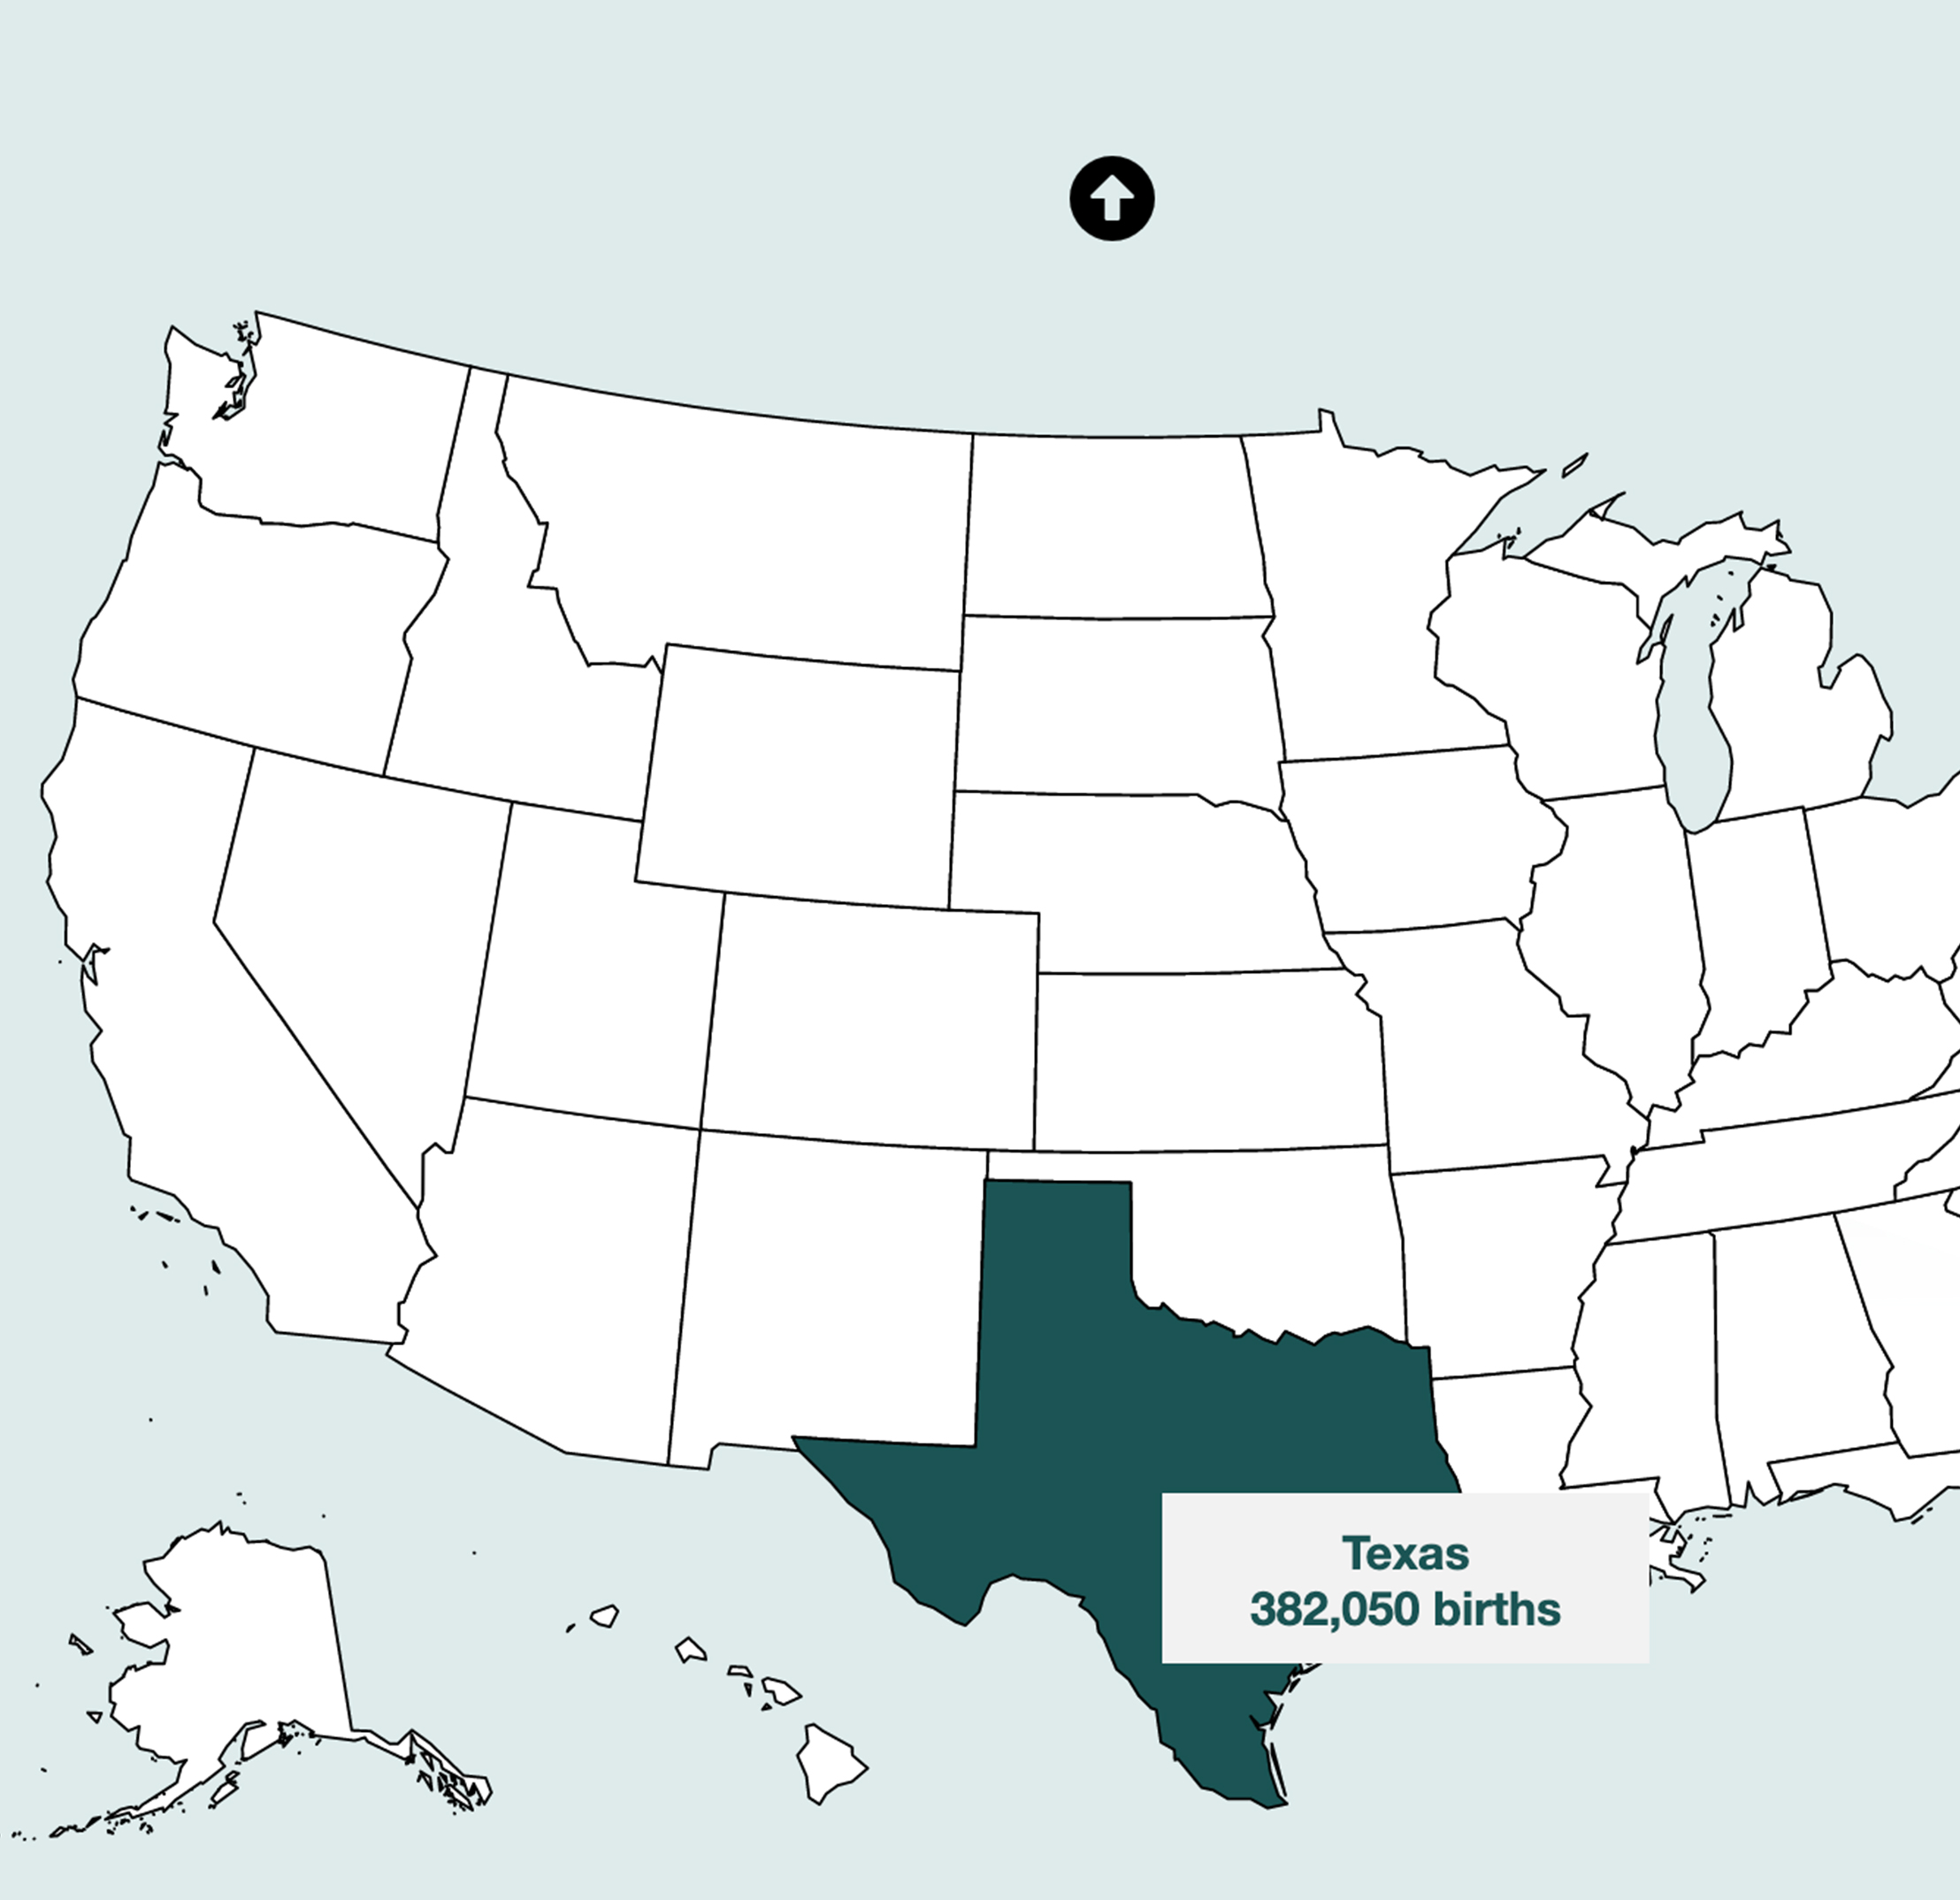
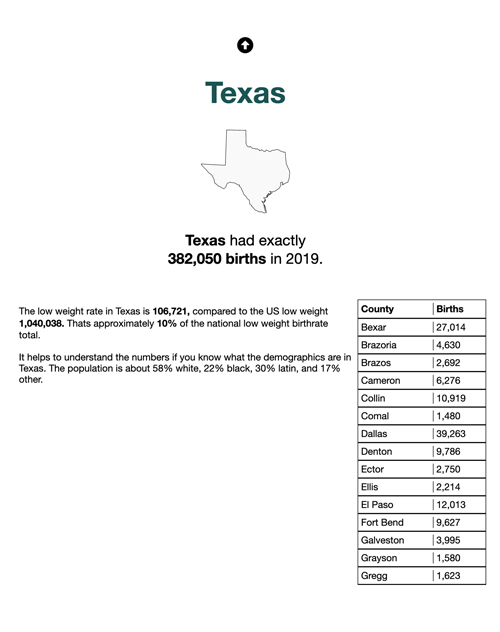
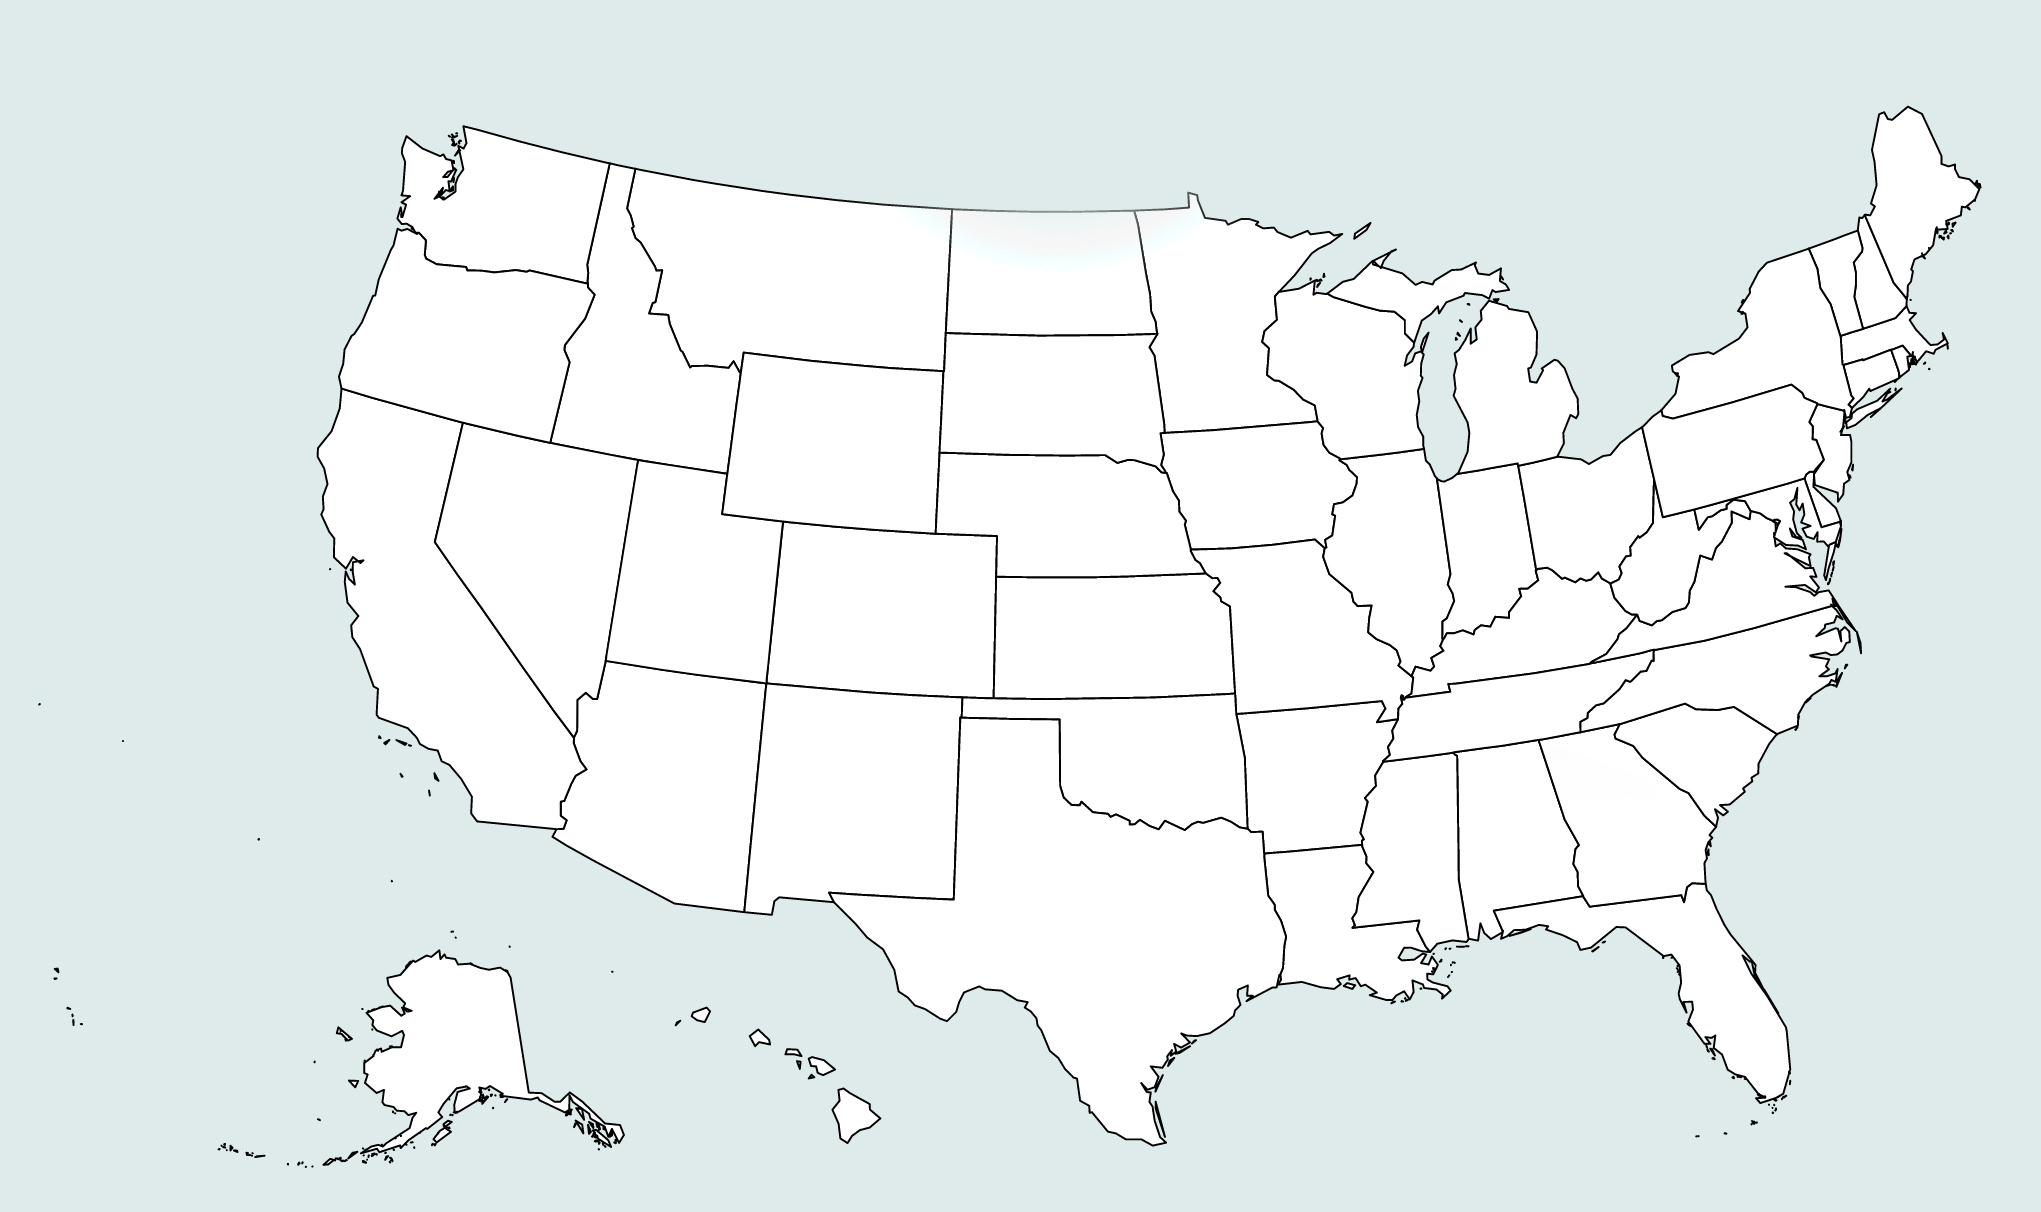
I broke up the map into individual states so they could each be animated. And from there, the stats were further broken down by county.


launched
My favorite thing about this site is that it can be easily used to tackle other data heavy and socially relevant topics. Gun control deaths. Minority women's healthcare stats. State spending on public school sports. Anything.
Launch project
Launch project